Most QR code campaigns are launched on instinct: choose a design, pick a landing page, print 10,000 flyers, and hope for the best. But with 99.5 million Americans scanning QR codes every month and marketers reporting 37% average click-through rates on QR-initiated journeys — nearly 15x higher than display advertising — there is too much performance potential to leave on the table. QR code A/B testing is the systematic method that separates guesswork from growth, letting you run controlled experiments to discover exactly what drives more scans, more conversions, and more revenue from every campaign.
This guide covers everything you need to know: what QR code A/B testing is, the five variables that move the needle most, a step-by-step setup process, how to measure results with UTM parameters and GA4, and real-world examples from restaurants, retail, events, and packaging campaigns.
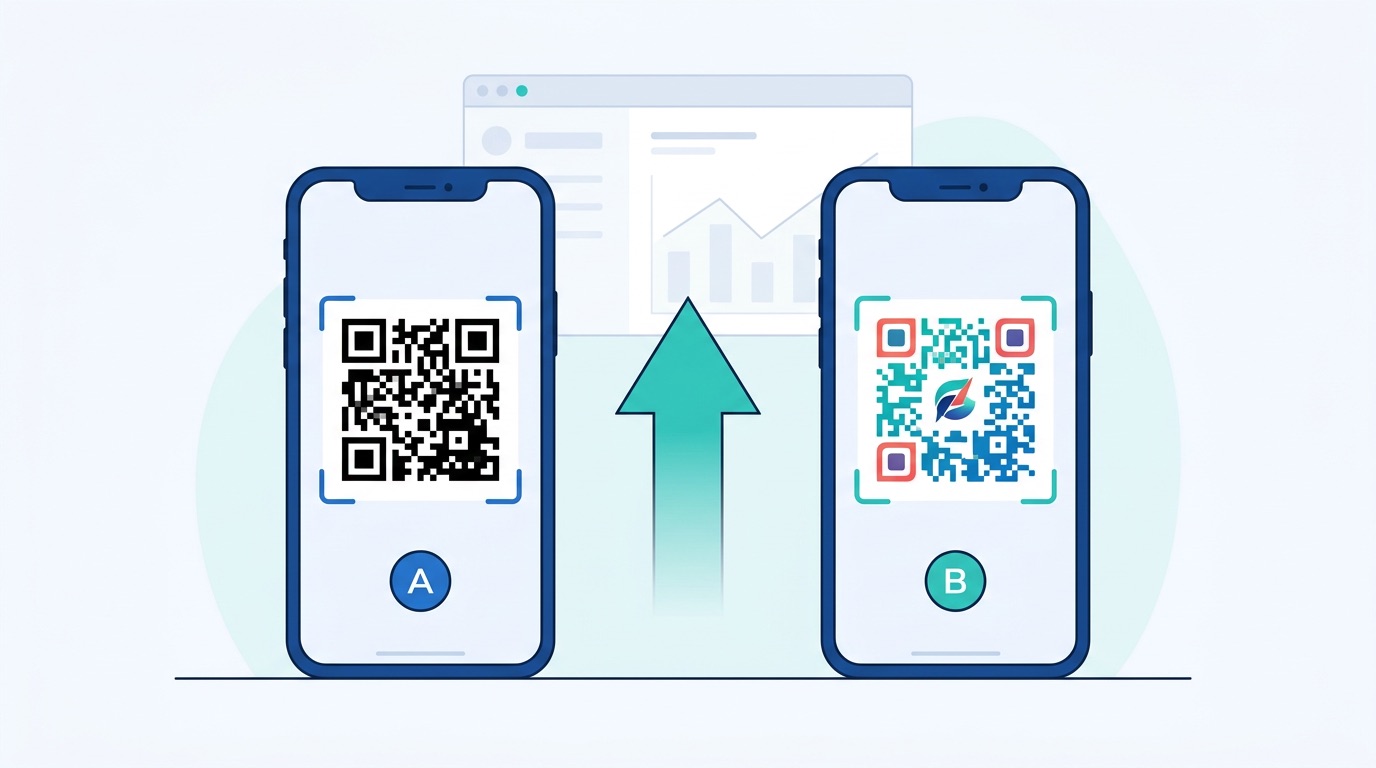
QR code A/B testing — also called split testing — is the practice of running two versions of a QR code campaign simultaneously, changing only one variable at a time, to determine which version performs better. One group of users encounters Variant A; another encounters Variant B. After collecting enough data, you compare scan rates, conversion rates, and downstream engagement metrics to pick the winner, then roll it out as the new control.
The "only one variable at a time" rule is the cornerstone of valid testing. Change the QR code color and the landing page and the CTA text simultaneously, and you will never know which factor drove the improvement (or the decline). True A/B tests isolate a single element so the data is actionable.
QR code A/B testing differs from traditional digital A/B testing in one important way: the touchpoint is physical. A QR code on a poster, a package, or a product label cannot be swapped mid-campaign the way a button color can be changed on a website. This is why dynamic QR codes are essential — they redirect through a tracking server, which means you can update the destination URL without reprinting, making phased testing possible even after materials have shipped.
The gap between an average QR campaign and an optimized one is substantial. Consider the research:
Small improvements compound quickly. A restaurant with 500 daily menu scans that lifts its conversion rate from 20% to 28% through landing-page A/B testing generates 40 additional conversions per day — without spending a penny more on printing or media. This is the power of systematic QR code marketing rather than set-and-forget campaigns.

Every element of a QR code deployment can, in principle, be tested. But the five variables below consistently deliver the highest-impact insights — start here before moving to more nuanced experiments.
Test the visual appearance of the code itself: color vs. black-and-white, round module corners vs. square, with a logo vs. without, branded frame vs. plain square. Design changes are easy to implement using a QR code generator with design tools, and their impact on scan intent is significant. Users remember colored codes 2.3x better than monochrome versions, which matters for repeat-scan campaigns.
The post-scan experience is where conversion happens. Test different landing pages: a product detail page vs. a dedicated offer page, a video vs. a static information page, a sign-up form with five fields vs. one field, or a homepage vs. a campaign-specific microsite. Since dynamic URL QR codes let you change the destination after printing, you can run these tests even on already-deployed materials.
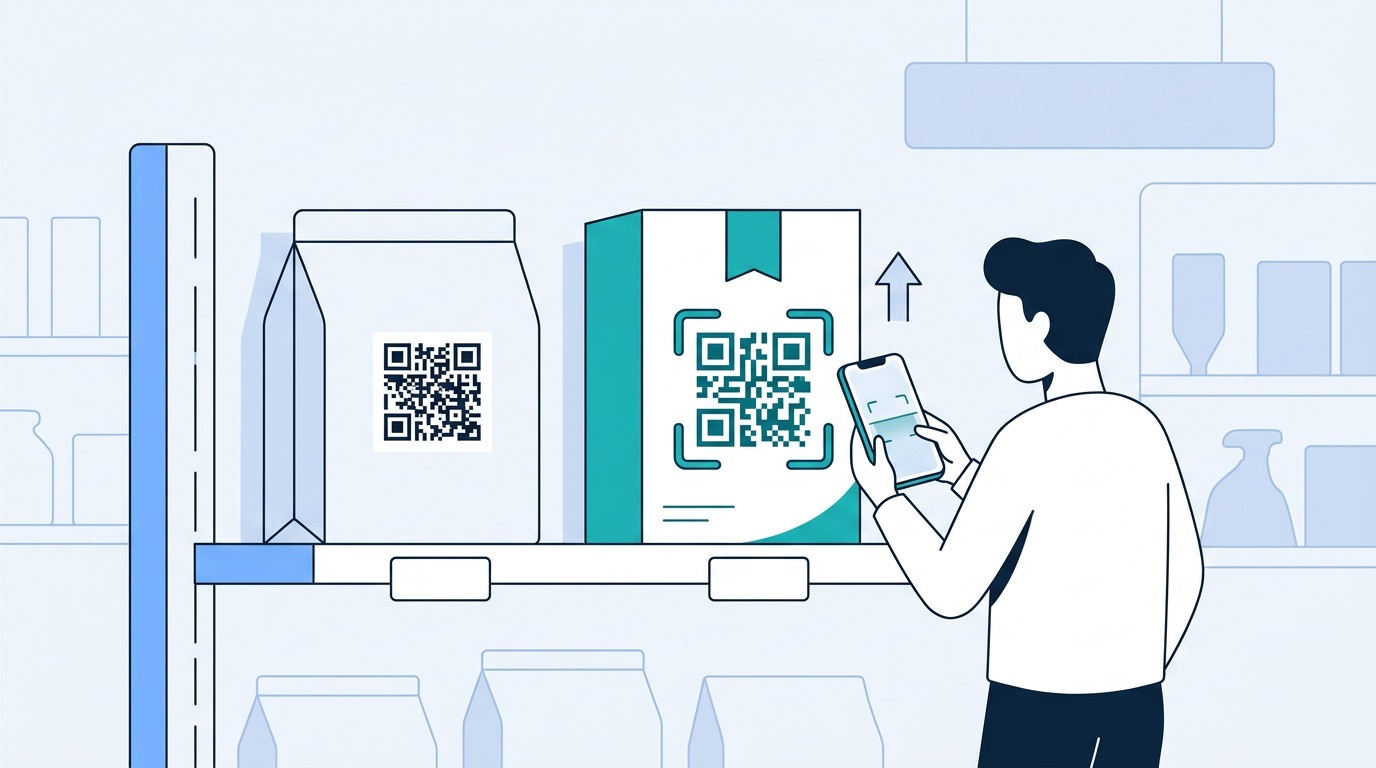
Where a QR code appears dramatically affects how many people see and scan it. Test front-of-pack vs. back-of-pack placement on product packaging, eye-level vs. lower-panel on posters, table card vs. printed menu in restaurants, or checkout counter vs. entry signage in retail. Industry benchmarks show scan rates ranging from 1–3% for print advertising up to 10–20% for event materials — placement is a major driver of that variance.
The instruction around the QR code shapes scan intent. Test "Scan to Save 15%" vs. "Scan for Exclusive Offer," "View Our Menu" vs. "See Today's Specials," or no frame text vs. a bold action phrase. Since 84% of people are more likely to scan when the use is clearly relevant, CTA copy tests often reveal large, fast wins.
For digital placements — QR codes on websites, email footers, or digital signage — you can test time-of-day or day-of-week deployment. For physical campaigns with expiry dates, test short-window urgency framing ("Offer ends Friday") against evergreen messaging.

A well-structured A/B test follows a consistent framework regardless of which variable you are testing. Here is a practical five-step process using Supercode.
Start with a specific, falsifiable statement: "A colored QR code with our brand logo will achieve a higher scan rate than a black-and-white code on the same flyer." Then define a single primary metric — scan rate (scans ÷ estimated impressions), post-scan conversion rate, or time-on-page. Avoid optimizing for multiple metrics simultaneously; it clouds the result.
In Supercode, create two separate dynamic QR codes pointing to the same initial destination. Use the design editor to apply exactly one difference between them (e.g., a colored frame for Variant B, none for Variant A). Name them clearly: "Campaign-A" and "Campaign-B." Dynamic codes are non-negotiable — they are the only type that records analytics and allows destination changes post-print.
Divide your distribution equally and randomly. For physical placements, this might mean printing equal quantities of two poster versions and distributing them to comparable locations — two similar retail stores, two equivalent wall positions, or alternating table cards in the same venue. For packaging, apply each variant to production runs of equal size. Ensure the environments are as equivalent as possible to minimize confounding variables.
Never judge results after 24–48 hours. Set a minimum test duration of two weeks to smooth out day-of-week variance. For lower-traffic placements (e.g., print ads in a niche publication), extend to four to six weeks. As a general guideline, aim for at least 200 scans per variant before drawing conclusions — below that, results are not statistically reliable.
Compare primary metrics between Variant A and B. If the difference exceeds 10–15% with sufficient sample size, you have a directional winner. Update all future materials to the winning variant and design the next test. This iterative loop — test, learn, implement, repeat — is how sophisticated teams build compounding performance gains over time. Link your QR analytics to your QR code tracking and analytics platform to see the full funnel in one view.
Design is the most immediately actionable testing variable because it directly influences scan intent before a user has even read your CTA. Here is what the data says and what to test first.
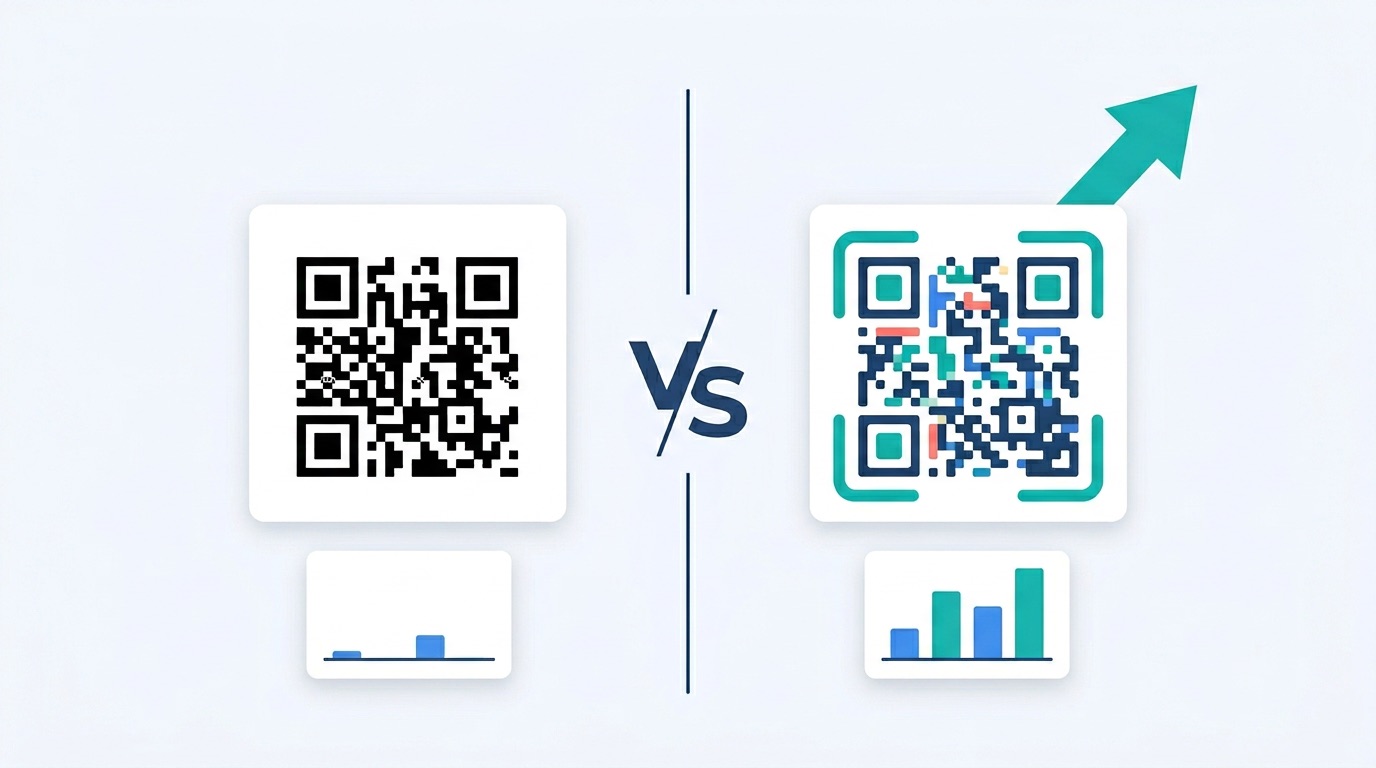
The most impactful design A/B test is color vs. black-and-white. Branded, colored QR codes consistently outperform standard monochrome versions by 25–40% in scan rate. When designing Variant B, use your brand's primary color for the modules (dark foreground) against a white or light background. Maintain a minimum 7:1 contrast ratio for reliable scanning across varied lighting conditions — going below this reduces first-scan success rates. Visit the complete QR code design guide for color contrast rules and error correction recommendations.
Adding a logo to the center of a QR code leverages error correction capacity (up to Level H = 30% data recovery) to embed branding without compromising scannability. Test: logo vs. no logo, brand icon vs. full wordmark, dark logo vs. light logo. Keep the logo footprint under 20–25% of the total code area to preserve reliable scanning. Branded QR codes with logos can increase recognition and scan intent significantly — especially in competitive retail environments where multiple codes compete for attention.
Test a full branded frame with a call-to-action label ("Scan to View Menu") against a bare code. Also test frame shape (rounded vs. rectangular) and whether a speech bubble, tag, or badge frame outperforms a plain border. These differences matter most for materials where the QR code has to earn attention — outdoor billboard advertising, brochures, and product packaging.
Getting the scan is half the battle. The post-scan experience determines whether that scan converts. Because dynamic QR codes allow destination swaps without reprinting, destination URL testing can run continuously — even on materials already in the field.
High-impact destination tests include:
Use UTM parameters on every destination URL to measure post-scan behavior in Google Analytics 4. Tag Variant A as utm_content=variant-a and Variant B as utm_content=variant-b, then compare Goal Completions, Average Session Duration, and Bounce Rate for each variant in your GA4 Explorations report.
For physical QR code campaigns, placement is often the highest-leverage variable — and the most overlooked. Industry benchmarks show a tenfold difference in scan rates between low-performing placements (print advertising: 1–3%) and high-performing ones (event materials: 10–20%). Small placement changes can generate comparable gains.
Placement tests to run by channel:
For placement tests on already-printed materials, use the same dynamic QR code but track separate UTM parameters for each location type. This lets you test post-scan performance by placement without running separate print runs.

Data quality makes or breaks a testing program. Here are the metrics to track and how to connect your QR analytics to downstream conversion data.
Apply consistent UTM tagging to every destination URL in your tests. A recommended structure for QR code A/B tests:
utm_source=qr-codeutm_medium=print (or digital, packaging, etc.)utm_campaign=campaign-nameutm_content=variant-a or utm_content=variant-bIn GA4, navigate to Explore > Free Form, use Session campaign and Session manual ad content as dimensions, and compare your chosen metric for each variant. For a deeper guide to QR-to-GA4 integration, see QR Code Tracking & Analytics: The Complete 2026 Guide.
A result is only meaningful if it is unlikely to be due to chance. As a practical rule, you need 200+ scans per variant and a directional difference of at least 10–15% before acting on results. For higher-stakes campaigns (e.g., packaging redesigns with six-figure print runs), use a proper significance calculator — tools like Optimizely's Stats Engine or VWO's Bayesian calculator are free to use. Aim for 95% confidence before declaring a winner.
Abstract frameworks are only useful when grounded in practice. Here are four industry examples showing what QR code A/B tests look like in the real world.
A casual dining chain tested two placements for their digital menu QR code: a printed code on the physical menu cover versus a standalone table tent card. The table tent generated 42% more scans per cover because it was visible before the diner opened the menu, capturing the high-intent moment of being seated. The restaurant rolled out table tents chain-wide and saw a 28% increase in digital menu engagement, leading to higher repeat-order rates from their loyalty app. See also: QR codes for restaurants.
A consumer goods brand A/B tested a QR code on the front panel of their product packaging against the same code on the back panel. The front placement achieved a 3.1% scan rate versus 1.4% for the back panel — a 121% improvement — primarily because front-panel placement captures shoppers at the shelf browsing moment rather than after purchase. They also tested their landing page: a product story video vs. a loyalty sign-up page. The loyalty sign-up page generated 40% more completed registrations per scan than the video. For retail QR strategy, visit QR codes for retail.
An events company running a B2B conference tested two vCard QR code placements for exhibitor lead capture: printed on the exhibitor name badge vs. on a physical handout card given at the booth. The handout card achieved a 67% higher scan rate than the badge because it could be placed in the visitor's hand at the moment of conversation — removing friction entirely. The team now distributes handout cards at all booths as standard practice. Learn more at the QR codes for events guide and trade show QR codes.
A B2B software company tested two landing pages for a QR code lead generation campaign run on conference materials. Variant A directed scanners to a five-field demo request form; Variant B used a single-field email capture with a "We'll send you the full details" promise. Variant B achieved a 2.8x higher completion rate, though lead quality required more nurturing. The team now uses the short form for cold audiences (OOH, events) and the long form for warm audiences (existing customer packaging inserts). For more lead generation strategies, see QR codes for lead generation.
Before running your first test, internalize these guardrails to avoid the most common testing mistakes.
For broader campaign optimization strategy, see QR Code Marketing: The Complete Strategy Guide and How QR Codes Increase Sales: 10 Proven Strategies for 2026.
QR code A/B testing is the practice of running two versions of a QR code campaign — changing only one variable at a time — to determine which version generates more scans, conversions, or engagement. It follows the same principles as digital split testing but accounts for the physical deployment context of QR codes.
Yes. Dynamic QR codes are essential for any testing program because they record analytics (scan counts, device types, locations, timestamps) and allow destination URL changes after printing. Static QR codes generate no data and cannot be updated — making it impossible to run meaningful tests or iterate on results.
Run tests for a minimum of two weeks, and aim to collect at least 200 scans per variant before drawing conclusions. For lower-traffic placements (e.g., niche print publications or infrequently visited retail locations), extend to four to six weeks. Declaring a winner too early based on small samples is the most common cause of misleading test results.
For most campaigns, QR code design (specifically, color vs. black-and-white) and destination URL (landing page optimization) deliver the largest and fastest results. Branded, colored QR codes consistently outperform monochrome versions by 25–40%, making design the highest-leverage first test for new campaigns. Once design is optimized, test landing pages to maximize post-scan conversion rate.
Use UTM parameters on your destination URLs — tag each variant with a unique utm_content value — and measure results in Google Analytics 4. Track primary metrics in your QR code platform's analytics dashboard (scan rate, unique scans) and downstream metrics in GA4 (conversion rate, session duration, bounce rate). Compare both dimensions to get a complete picture of variant performance.
Yes, if you used dynamic QR codes. Since dynamic codes redirect through a tracking server, you can change the destination URL without reprinting — which means you can run landing page and destination URL A/B tests even after materials have been deployed. The QR code image itself remains unchanged on the printed material.
Only one variable per test. Testing multiple variables simultaneously (multivariate testing) requires much larger sample sizes to achieve statistical validity and makes it impossible to attribute results to a specific change. If you want to test multiple variables, run them as sequential tests — complete one test, implement the winner, then test the next variable.
QR code A/B testing transforms campaigns from one-shot print runs into continuously improving performance engines. By systematically testing design, destination, placement, and CTA variables — one at a time, with proper sample sizes and UTM tracking — you can identify the combinations that maximize scan rates and post-scan conversions for your specific audience and context.
The brands that are pulling ahead in QR code marketing are not just deploying more codes — they are learning faster. Every test you run generates institutional knowledge about what your audience responds to, and that knowledge compounds over time into a durable competitive advantage.
Ready to start your first QR code A/B test? Create your dynamic QR codes in Supercode — with built-in analytics, design customization, and bulk generation tools. Explore pricing plans or try free today.
For more QR code campaign strategies, see QR Code Statistics 2026, QR Code Trends 2026, and Supercode solutions for every industry.