
Every week, thousands of businesses print QR codes on packaging, posters, menus, and event materials — and have no idea which placements actually drove traffic or conversions. Without QR code UTM parameters, your physical marketing is a black box: you can see total website visitors, but you cannot attribute them to the billboard versus the brochure versus the product label. With proper QR code tracking in place, every scan becomes a named, attributable data point — feeding your analytics platform with the same precision as a paid search click.
This guide covers everything marketers need to connect physical QR campaigns to digital analytics: what UTM parameters are, how to structure them for QR codes, a step-by-step setup process, naming conventions that prevent data fragmentation, GA4 reporting, channel-specific examples, and common mistakes that silently corrupt your attribution data.
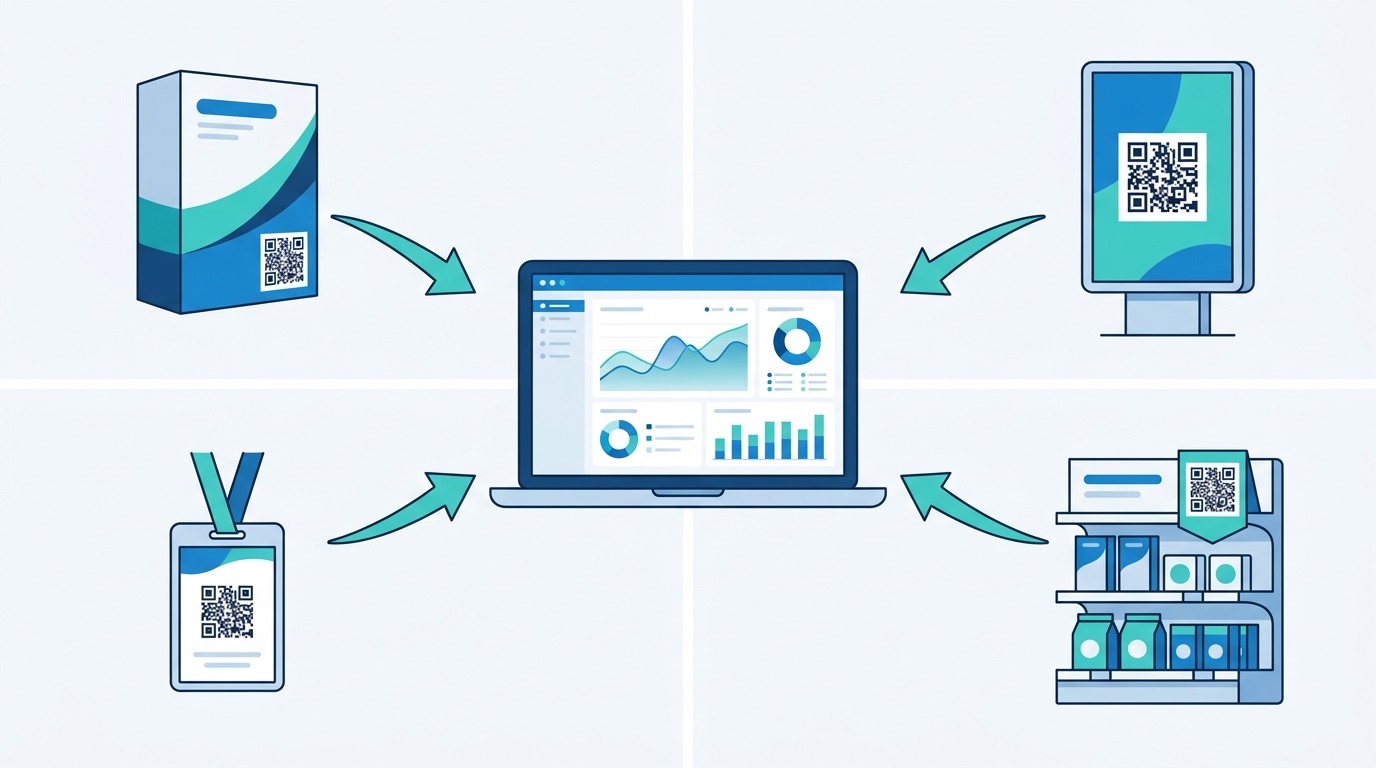
The fundamental problem with physical marketing is attribution. A brand running a QR code on product packaging, a store poster, and a trade show handout simultaneously has no way to know — without UTM tracking — which placement drove more traffic, which converted better, or which was worth the print spend. This is the offline-to-online attribution gap, and UTM parameters close it completely.
The stakes are significant. Businesses using QR codes for marketing report 37% average click-through rates on QR-initiated customer journeys — nearly 15 times higher than display advertising's 2–5% CTR. With 99.5 million Americans scanning QR codes every month and 94% of marketers now incorporating QR codes into campaigns, the volume of physical-to-digital traffic being generated is enormous. Without UTM parameters, almost all of that traffic appears in Google Analytics as either direct (no referrer) or organic search — completely unattributed and invisible to marketing ROI analysis.
UTM parameters solve this by appending campaign information directly to the destination URL. When a user scans your QR code, GA4 reads the UTM tags from the URL and records: where this user came from, which campaign sent them, and which specific placement or variant they scanned. The data flows into your analytics reports exactly like a digital ad click — fully attributed and actionable.
Teams that standardize UTM naming conventions report a 29% improvement in campaign attribution accuracy, according to UTM best practice research. For organizations running multi-location campaigns, seasonal packaging programs, or event-based QR deployments, this level of precision is the difference between optimizing spend and flying blind.

UTM stands for Urchin Tracking Module — a legacy of Google's acquisition of the analytics firm Urchin. Today, UTM parameters are standardized query string additions that Google Analytics, GA4, and most analytics platforms recognize and parse automatically.
There are five standard UTM parameters. For QR code campaigns, three are essential and two are optional but powerful.
Identifies the specific origin of the traffic. For QR codes, this should describe the physical placement where the code appears: packaging, poster, menu, business-card, event-badge, billboard, brochure. Keep it lowercase, one word or hyphenated, no spaces. In GA4 reports, this appears as the "Session source" dimension — the first thing you look at when comparing placement performance.
Identifies the marketing channel or medium type. For all QR code campaigns, set this consistently to qr-code or print. Using a consistent medium value means you can filter your entire GA4 reports to show only QR-code-generated traffic across all sources and campaigns at once — an essential view for channel-level ROI analysis.
Names the specific marketing campaign the QR code belongs to. Examples: summer-sale-2026, product-launch-q1, trade-show-chicago, loyalty-program-jan. Include a date or season suffix so you can distinguish recurring campaigns year-over-year. This dimension is what lets you see all placements from one campaign side by side in GA4 Acquisition reports.
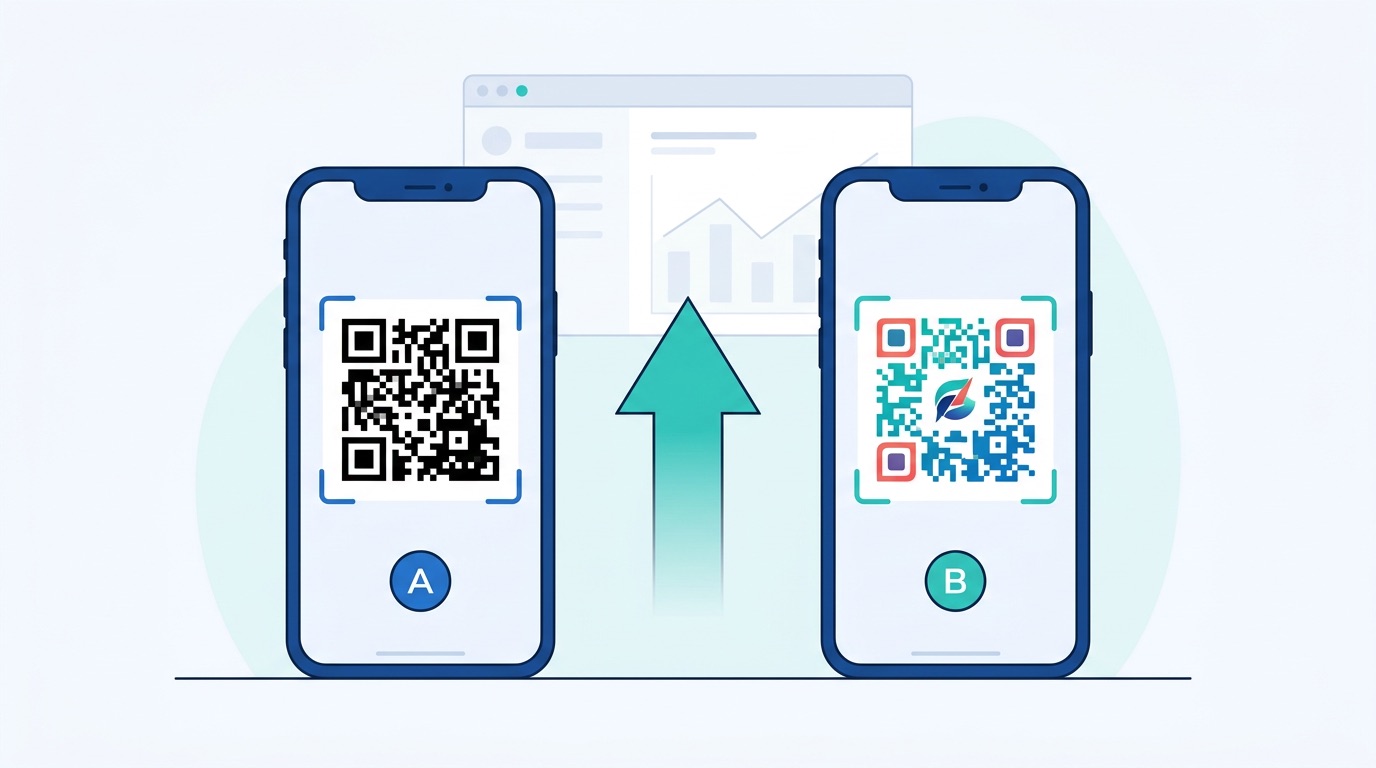
Identifies the specific variant, creative, or placement within a campaign — crucial for QR code A/B testing. Use it to differentiate: front-panel vs back-panel, table-card vs printed-menu, or variant-a vs variant-b. This is the parameter that enables granular placement optimization within a single campaign.
Originally designed for paid search keyword tracking. For QR codes, this is occasionally repurposed to segment audiences (e.g., existing-customers vs new-prospects) or to tag geographic variants (london, manchester). Use sparingly and only when it adds meaningful segmentation that utm_content cannot provide.
A well-formed QR code destination URL looks like this:
https://supercode.com/pricing?utm_source=packaging&utm_medium=qr-code&utm_campaign=product-launch-q1&utm_content=front-panel
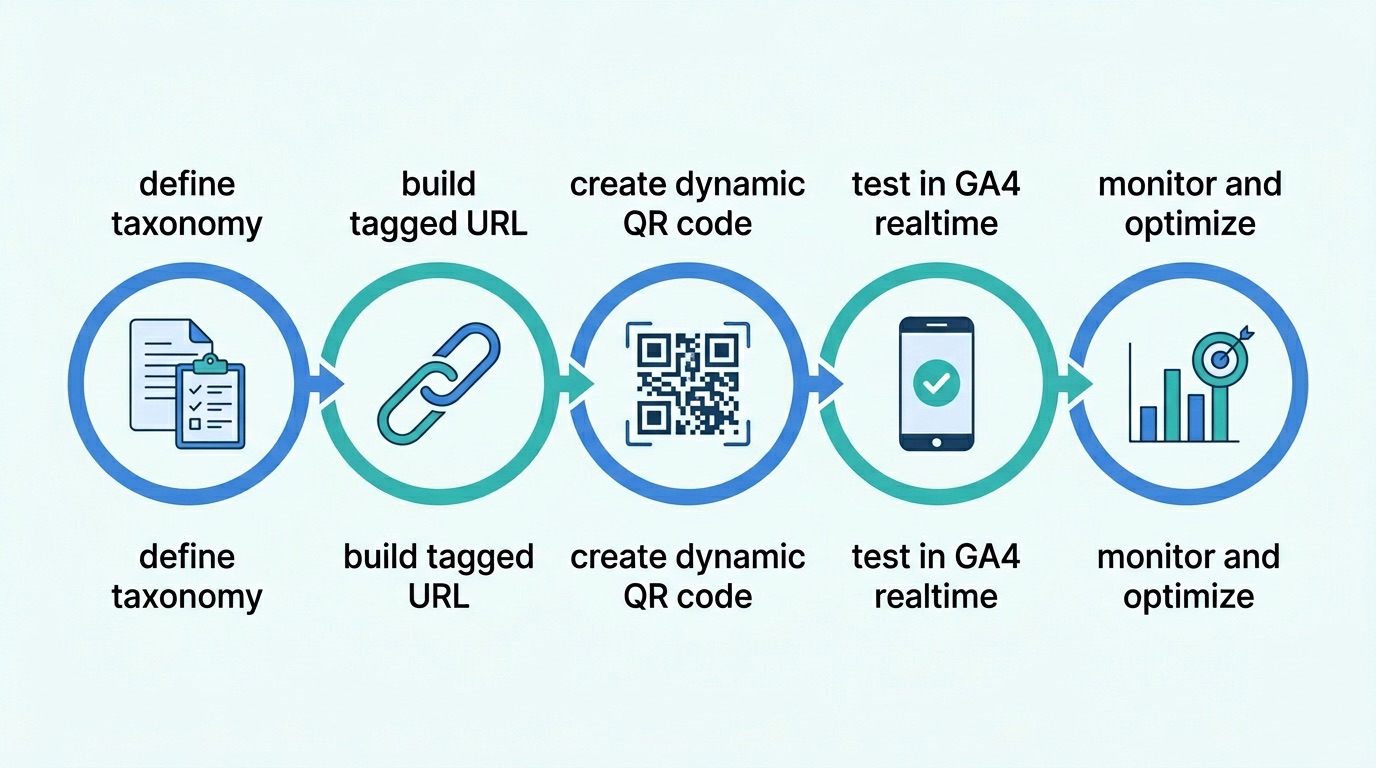
Follow this five-step process to create properly tagged QR codes that feed clean, attributed data into GA4 from day one.
The single most important UTM rule is consistency. Decide on your naming conventions before generating a single code. Create a simple internal document listing allowed values for utm_source (every placement type your organization uses), utm_medium (always qr-code), and utm_campaign naming format. Share this with every team member who creates QR codes. GA4 is case-sensitive — Packaging and packaging become two separate line items in your reports, permanently fragmenting your data.
Use Google's Campaign URL Builder (support.google.com) or any UTM generator to create the tagged URL. Enter your destination URL and fill in the three required parameters. Review the generated URL carefully — check for uppercase letters, accidental spaces, and typos before proceeding. One error here affects every scan from every code printed with this URL.
In Supercode, create a new URL QR code and paste the UTM-tagged URL as the destination. Use a dynamic code, not a static one. Dynamic QR codes redirect through a tracking server, which means you can update the destination URL after printing if campaign details change — without reprinting. They also provide a native analytics layer (scan counts, device types, locations) that complements your GA4 UTM data. A static code with a hard-coded UTM URL cannot be updated after printing, locking you into that destination permanently.
Before sending materials to print, scan the QR code and open GA4 > Reports > Realtime. Within 30 seconds, you should see your session appear with the correct source, medium, and campaign values. If the session shows as "direct" or the UTM values are wrong, troubleshoot the URL before printing thousands of flyers. This step takes two minutes and prevents costly reprints. Also verify the landing page loads correctly on mobile — the primary scan environment.
After launch, review your GA4 Acquisition > Traffic Acquisition report weekly. Filter by utm_medium = qr-code to see all QR-generated sessions. Compare placements by session count, engagement rate, goal completions, and revenue (if applicable). Use these insights to allocate future print budget toward the highest-performing placements and pause underperformers. Combine with your QR code platform analytics (scan data) for a complete picture: scan rate tells you how many people engaged, UTM data tells you what they did after scanning.
The biggest cause of corrupted attribution data is inconsistent naming. 30% of companies skip UTM markup on more than 30% of their campaigns, and the majority of those that do tag use inconsistent conventions. Here is a practical naming framework that works as your QR code program grows.
Use lowercase, hyphen-separated values throughout. Follow a logical hierarchy:
packaging, poster, menu, receipt, billboard, trade-show, event-badge, business-card, brochure, windowqr-code (never vary this — it is your channel identifier)[campaign-name]-[year] or [campaign-name]-[season]-[year], e.g., loyalty-launch-2026, summer-sale-2026, trade-show-chicago-2026front-panel, back-panel, table-card, entry-sign, variant-a, variant-bFor brands running QR codes across multiple store locations or regional markets, use utm_source to identify the region and utm_content for the placement type:
utm_source=london-oxford-street, utm_content=window-signutm_source=manchester-arndale, utm_content=shelf-edgeThis structure lets you compare region performance in GA4 by filtering on utm_campaign and breaking down by utm_source. The bulk QR code generation feature in Supercode makes it practical to create unique UTM-tagged codes for dozens of locations simultaneously via CSV import.
Always include a year (and optionally a season) in utm_campaign. Without it, a campaign named summer-sale that runs in 2025 and 2026 will merge all data under one name — making year-over-year comparison impossible. Use summer-sale-2025 and summer-sale-2026 as distinct campaign names.
UTM parameters tell you what happens after the scan. Dynamic QR code analytics tell you about the scan itself. Together, they give you complete attribution across the physical-digital boundary.
Here is what each layer provides:
Dynamic codes enable a critical capability: destination URL updates without reprinting. If you need to change a campaign landing page after print materials have shipped — say, you want to run an A/B test on the post-scan experience — you update the destination in Supercode and all existing printed codes automatically redirect to the new URL. The UTM parameters remain intact because they are embedded in the new destination URL, not in the QR code itself.
Dynamic codes also deliver 60% higher engagement rates than static codes and make marketers 3.5 times more likely to track and optimize their campaigns — because the data is available and actionable. For any serious UTM tracking program, dynamic codes are non-negotiable. Learn more at Supercode's use case library.
GA4's interface can be unfamiliar to marketers used to Universal Analytics. Here is a practical guide to finding and interpreting your QR code UTM data.
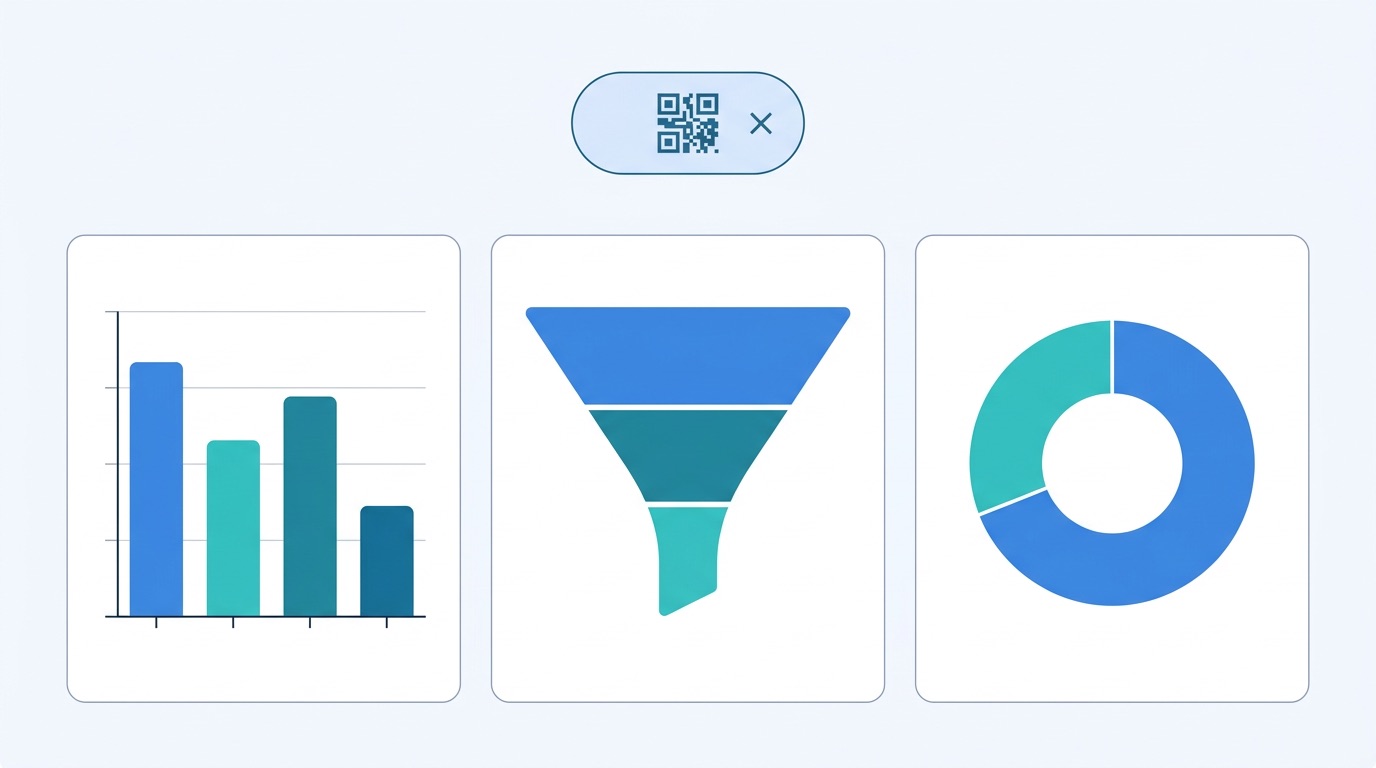
Navigate to Reports > Acquisition > Traffic Acquisition. In the primary dimension dropdown, select Session medium and look for qr-code (or whatever value you used for utm_medium). This shows all sessions generated by your QR codes in aggregate. Compare against other mediums (organic, email, paid) to see QR code's contribution to total traffic.
Change the primary dimension to Session campaign and filter by Session medium = qr-code. This breaks down performance by individual campaign — letting you compare a trade show campaign against a packaging campaign against a seasonal promotion. Add a secondary dimension of Session source to see which physical placements within each campaign drove the most traffic.
For deeper analysis, use Explore > Free Form. Set dimensions to: Session source, Session medium, Session campaign, Session manual ad content. Add metrics: Sessions, Engagement rate, Conversions, Revenue. This view gives you a complete placement-level breakdown — every QR code placement in every campaign, side by side, with full conversion data. Filter by utm_medium = qr-code to isolate QR traffic from all other sources.
UTM attribution is only as valuable as the conversions you track. In GA4, mark your key actions as Conversion Events: purchase, form_submit, sign_up, add_to_cart, or any custom event that represents a meaningful user action. Once marked as conversions, these appear in the Acquisition reports alongside your UTM data — directly attributing revenue or leads to specific QR code placements. For physical retail QR codes linked to loyalty sign-ups or product registrations, this is how you calculate direct ROI per placement.
UTM parameters work differently across channels. Here are practical examples and recommended UTM structures for the most common QR code deployment contexts.
Packaging QR codes face the highest volume but lowest scan rates (2–5% average). Use UTM to understand which packaging format or panel placement drives better post-scan behavior. Recommended structure:
utm_source=packaging, utm_medium=qr-code, utm_campaign=product-name-2026, utm_content=front-panelRun front-panel vs back-panel tests simultaneously using different utm_content values. Also test product packaging QR destinations: product story page vs loyalty sign-up vs sustainability report. Track time-on-page alongside conversion rate to understand engagement quality. See also: food packaging QR codes.
For poster campaigns and outdoor advertising, location context is the most valuable dimension to track. Use utm_source to identify the specific placement location:
utm_source=oxford-street-poster, utm_medium=qr-code, utm_campaign=brand-awareness-q2-2026utm_source=waterloo-billboard, utm_medium=qr-code, utm_campaign=brand-awareness-q2-2026For multi-city outdoor campaigns, compare conversion rates between locations. High scan rate with low conversion suggests a mismatch between the poster audience and the landing page; high conversion with low scan rate suggests better placement or framing is needed to earn the initial scan.
Restaurants using digital menus and QR ordering can track UTM parameters to compare different table types, staff recommendation effectiveness (receipt vs table card), and loyalty program conversion rates. Use utm_content to differentiate table locations or service points:
utm_source=menu, utm_medium=qr-code, utm_campaign=loyalty-jan-2026, utm_content=table-cardutm_source=receipt, utm_medium=qr-code, utm_campaign=loyalty-jan-2026, utm_content=bottom-stripVisit QR codes for restaurants for hospitality-specific deployment guides, and QR codes for menus for menu-specific UTM use cases.
Events generate the highest scan rates (10–20%) but the shortest attribution window. QR codes on event badges, booth signage, and handout materials need distinct UTM values to understand which touchpoints drove post-event engagement. Use utm_source for the material type and utm_campaign for the event name:
utm_source=booth-poster, utm_medium=qr-code, utm_campaign=expo-london-march-2026utm_source=handout-card, utm_medium=qr-code, utm_campaign=expo-london-march-2026utm_source=event-badge, utm_medium=qr-code, utm_campaign=expo-london-march-2026Combine with CRM integration to track leads generated at each event touchpoint through the full sales cycle. See: trade show QR codes and event management QR codes.
Retail QR codes at shelf-edge displays, checkout counters, and shop windows benefit from UTM tracking to compare placement effectiveness within a single store. For multi-location retail chains, use utm_source for the store location and utm_content for the in-store position:
utm_source=store-london-bridge, utm_content=shelf-edgeutm_source=store-london-bridge, utm_content=checkout-counterAggregate by utm_source in GA4 to compare store performance across your network. See also: retail QR codes.
These errors are widespread and silently corrupt attribution data, often for weeks before anyone notices.
Packaging, packaging, and PACKAGING are three separate sources in your reports. Enforce all-lowercase as an absolute rule across your organization%20 in URLs. utm_campaign=summer%20sale and utm_campaign=summer-sale are two different campaigns in GA4 and will never merge. Use hyphens or underscores onlyutm_medium=print and others use utm_medium=qr-code, you will never be able to see all QR-generated traffic in one filter. Choose one value and use it for every codeutm_campaign=campaign1 or utm_campaign=sale are useless in reports. Always use descriptive, date-stamped names: utm_campaign=summer-packaging-2026utm_content=variant-a and utm_content=variant-b — and connect this to your QR code A/B testing program for a complete optimization loopOnce basic UTM tracking is in place, these advanced strategies unlock deeper insights and attribution capabilities.
Your QR code platform provides scan-level data (how many people engaged with the code) and GA4 provides session-level data (what they did after scanning). Together, you can calculate a precise scan-to-conversion rate: divide GA4 goal completions from a specific UTM source by the total scans recorded for that same code. This metric gives you true campaign ROI at the placement level — and enables the kind of QR code marketing optimization that compounds over time.
For QR code lead generation campaigns at events, in brochures, or on packaging, combine UTM tagging with a short post-scan form (one or two fields). Tag the form submission as a GA4 conversion event. Now every lead is attributed to the exact physical touchpoint that generated it — whether it was a trade show booth, a product insert, or a direct mail piece. Businesses using this approach report that 95% collect valuable first-party data through QR-initiated forms.
For customer journeys that involve multiple physical and digital touchpoints, UTM parameters enable multi-touch attribution analysis. A user might scan a QR code on packaging (first touch), visit via organic search a week later (second touch), and convert after clicking an email (third touch). GA4's data-driven attribution model uses all UTM-tagged sessions in the path to assign credit appropriately. Without UTM tags on the packaging QR code, that first touch is invisible — and packaging gets zero credit in the attribution model. For detailed analytics strategy, see QR code tracking and analytics.
GA4 allows you to register custom dimensions that capture information beyond the five standard UTM parameters. For QR code campaigns, useful custom dimensions include: store region, campaign manager, print run ID, or placement material type. Register these as custom parameters in your UTM URL (e.g., &geo=london&material=poster) and configure matching custom dimensions in GA4 settings. This enables segmentation that standard UTM parameters alone cannot provide — especially useful for national retail chains or franchise networks running regional QR code programs.
UTM parameters are tracking tags added to a destination URL that identify where a visitor came from, which campaign sent them, and which specific placement they scanned. For QR codes, they bridge the gap between physical marketing (posters, packaging, events) and digital analytics — enabling the same attribution precision as digital advertising in Google Analytics 4.
You can technically embed UTM parameters in a static QR code's destination URL. However, dynamic QR codes are strongly recommended because: (1) they allow destination URL updates after printing if you need to correct a UTM error or change the landing page, (2) they provide a native scan analytics layer that complements GA4 UTM data, and (3) they redirect through a tracking server so scan data is captured independently of whether the user visits the full URL.
Use qr-code consistently for all QR code campaigns. Some marketers use print, which works but is less specific — you lose the ability to isolate QR code traffic separately from other print media like direct mail or magazine ads. Standardizing on qr-code as the medium value lets you filter to QR-specific traffic across all sources and campaigns with a single filter in GA4.
Use the same utm_campaign value for all codes in the campaign, and differentiate individual placements using utm_source (for different physical locations or material types) and utm_content (for variants within the same placement). In GA4, filter by campaign to see all placements together, then break down by source and content to compare individual code performance.
Yes. After scanning a UTM-tagged QR code, open GA4 > Reports > Realtime. Within 30 seconds, your session will appear with the correct source, medium, and campaign values visible. This is the recommended testing method before committing to print production — scan, check Realtime, verify parameters, then approve for print.
If you used a dynamic QR code, you can update the destination URL to correct the UTM values — the physical code remains unchanged. If you used a static QR code, the UTM values are permanently encoded in the code and cannot be changed without reprinting. This is the primary practical reason to always use dynamic codes for UTM tracking campaigns.
In GA4, set up Conversion Events for your key actions (purchase, sign-up, form submission). In the Traffic Acquisition report, filter by utm_medium = qr-code and review Conversions and Revenue by source and campaign. Divide total revenue (or lead value) by the campaign's print production cost to calculate ROI per placement. For even more precision, cross-reference GA4 conversion data with your QR code platform's scan counts to calculate a scan-to-conversion rate at the individual code level.
QR code UTM parameters are the bridge that connects your physical marketing investments to measurable digital outcomes. Every campaign that runs without proper UTM tagging is permanently unattributed — that data can never be recovered. Every campaign that runs with clean UTM parameters feeds your analytics with precise placement-level attribution that compounds over time into a competitive intelligence advantage.
The setup takes minutes. The payoff is a complete, accurate picture of which physical placements drive real business outcomes — and the ability to allocate future print budget based on evidence, not instinct.
Ready to create UTM-tagged dynamic QR codes? Start with Supercode for free — with built-in analytics, dynamic code management, and bulk generation for multi-location campaigns. View pricing plans or explore all QR code solutions.
For related campaign optimization strategies, see QR Code Statistics 2026, How QR Codes Increase Sales, and the Complete QR Code Marketing Guide.